The long read: For 10 years, Nasa has been flying over the ice caps to chart their retreat. This data is an invaluable record of climate change. But does anyone care?
From the window of a Nasa aircraft flying over the Arctic, looking down on the ice sheet that covers most of Greenland, its easy to see why it is so hard to describe climate change. The scale of polar ice, so dramatic and so clear from a plane flying at 450 metres (1,500ft) high enough to appreciate the scope of the ice and low enough to sense its mass is nearly impossible to fathom when you arent sitting at that particular vantage point.
But its different when you are there, cruising over the ice for hours, with Nasas monitors all over the cabin streaming data output, documenting in real time dramatising, in a sense the depth of the ice beneath. You get it, because you can see it all there in front of you, in three dimensions.
Imagine a thousand centuries of heavy snowfall, piled up and compacted into stone-like ice atop the bedrock of Greenland, an Arctic island almost a quarter the size of the US. Imagine all of modern human history, from the Neolithic revolution 12,000 years ago when humans moved from hunting and gathering to agriculture, and from there, eventually, to urban societies until today. All of the snow that fell on the Arctic during that entire history is gathered up in just the top layers of the ice sheet.
Imagine the dimensions of that ice: 1.71m sq km (656,000 sq miles), three times the size of Texas. At its belly from the top layer, yesterdays snowfall, to the bottom layer, which is made of snow that fell out of the sky 115,000-130,000 years ago it reaches 3,200 metres (10,500ft) thick, nearly four times taller than the worlds highest skyscraper.
Imagine the weight of this thing: at the centre of Greenland, the ice is so heavy that it warps the land itself, pushing bedrock 359 metres (1,180ft) below sea level. Under its own immense weight, the ice comes alive, folding and rolling in solid streams, in glaciers that slowly push outward. This is a head-spinningly dynamic system that we still dont fully understand and that we really ought to learn far more about, and quickly. In theory, if this massive thing were fully drained, and melted into the sea, the water contained in it would make the worlds oceans rise by 7 metres (23ft).
When you fly over entire mountain ranges whose tips barely peek out from under the ice and these are just the visible ones its possible to imagine what would happen if even a fraction of this quantity of pent-up freshwater were unleashed. You can plainly see how this thing would flood the coasts of the world, from Brooklyn to Bangladesh.
The crew of Nasas Operation IceBridge have seen this ice from every imaginable angle. IceBridge is an aerial survey of the polar regions that has been underway for nearly a decade the most ambitious of its kind to date. It has yielded a growing dataset that helps researchers document, among other things, how much, and at what rate, ice is disappearing from the poles, contributing to global sea-level rises, and to a variety of other phenomena related to climate change.
Alternating seasonally between the north and south poles, Operation Icebridge mounts months-long campaigns in which it operates eight- to 12-hour daily flights, as often as weather permits. This past spring season, when I joined them in the Arctic, they launched 40 flights, but had 63 detailed flight plans prepared. Operation IceBridge seeks to create a continuous data record of the constantly shifting ice by bridging hence the name data retrieved from a Nasa satellite that ended its service in 2009, called ICESat, and its successor, ICESat-2, which is due to launch next year. The Nasa dataset, which offers a broad overview of the state of polar ice, is publicly available to any researcher anywhere in the world.
In April, I travelled to Kangerlussuaq, in south-west Greenland, and joined the IceBridge field crew a group of about 30 laser, radar, digital mapping, IT and GPS engineers, glaciologists, pilots and mechanics. What I saw there were specialists who have, over the course of almost 10 years on this mission, mastered the art and science of polar data hunting while, at the same time, watching as the very concept of data, of fact-based discourse, has crumbled in their culture at home.
On each flight, I witnessed a remarkable tableau. Even as Arctic glaciers were losing mass right below the speeding plane, and even as raw data gleaned directly from those glaciers was pouring in on their monitors, the Nasa engineers sat next to their fact-recording instruments, sighing and wondering aloud if Americans had lost the eyes to see what they were seeing, to see the facts. What they told me revealed something about what it means to be a US federally funded climate researcher in 2017 and what they didnt, or couldnt, tell me revealed even more.
On my first morning in Greenland, I dropped in on a weather meeting with John Sonntag, mission scientist and de facto field captain for Nasas Operation IceBridge. I stood inside the cosy weather office at Kangerlussuaq airport, surrounded by old Danish-language topographical maps of Greenland, as Sonntag explained to me that the ice sheet, because of its shape, can generate unique weather patterns (the ice isnt flat, its curved, he said, making a little mound shape with his hands).
The fate of the polar ice has occupied the last decade of his life (Im away from home so much its probably why Im not married). But at pre-flight weather meetings, polar ice is mostly of concern to him for the quirky way it might affect that days weather. The figure in Sonntags mind this morning isnt metres of sea rise, but dollars in flight time. The estimated price tag for a flight on Operation IceBridge is about $100,000; a single hour of flight time is said to cost $10-15,000. If Sonntag misreads the weather and the plane has to turn back, he loses flight time, a lot of taxpayers money, and precious data.
I would come to view Sonntag as something of a Zen sage of atmospheric conditions. He checks the weather the moment he wakes in the morning, before he eats or even uses the bathroom. He told me that it wasnt simply about knowing what the weather is. With weather, there is no is. Whats needed is the ability to grasp constant dynamic change.
What Im doing, he said, is correcting my current reading against my previous one which he had made the last possible moment the night before, just before falling asleep. Basically, Im calibrating. The machine that he is calibrating, of course, is himself. This, as I would learn, was a pretty good summary of Sonntags modus operandi as a leader: constantly and carefully adjusting his readings in order to better navigate his expeditions shifting conditions.
Nevertheless, despite the metaphorical implications of his weather-watching, Sonntag was ever focused on the literal. At the weather meeting, I asked him about his concern over some low cloud cover that was developing a situation that could result in scrubbing the flight. Was his concern for the functionality of the aircrafts science equipment, its ice-penetrating radars, its lasers and cameras?
On that day, as it turned out, Sonntag was more worried about pilot visibility. You know, so we dont fly into a mountain, he explained, without taking his eyes off the blobs dancing across the monitors. That kind of thing.
A few weeks before I met Sonntag, a reporter had asked him: What makes this real to you? The question had startled him, and he was evidently still thinking about it. I honestly didnt know what to say, he told me.
Sonntag cuts a trim, understated figure in his olive green Nasa flight suit, fleece jacket and baseball cap, and his enthusiasms and mellow ironies tend to soften his slow-burn, man-on-a-literal-mission intensity. I could imagine how a reporter might miss the underlying zeal; but get to know Sonntag and youll learn why, even three weeks later, that question was still rattling around his head.
Im still kind of at a loss, to be honest, he told me. What makes it real? I mean, wow, where do I start?
It is indeed a strange question to ask someone who was once on a high-altitude flight when temperatures fell so low that the planes fuel turned solid, almost sending it straight down into Antarctica, directly on to the ice, in the middle of the darkest of nights. Each of the 63 flight plans for this season in the Arctic was the result of months of meticulous planning. A team of polar scientists from across the US sets the research priorities, in collaboration with flight crews, who make sure the routes are feasible; the mission is managed from Nasas Goddard Space Flight Center in Maryland.
Sonntag is there at every phase, including at the construction and installation of the scientific instruments, and he is the person in the field responsible for executing the mission. He is supposed to have a plan for every contingency: if the plane goes down on the ice, hes got plans for that, too. He is responsible for making sure that his crew have adequately backed up and stored many terabytes of data, and that their own creature comforts are taken care of. On days off, he cooks gumbo for them.
The reporter probably had something else in mind. The melting of ice, the rising waters, and all the boring-seeming charts that document the connections between the two what makes that real? To Sonntag and his crew, it is as real as the data that they have personally helped fish out of the ice.
Sea levels, which were more or less constant for the past 2,000 years, have climbed at a rate of roughly 1.7mm a year in the past century; in the past 25 years, that rate has doubled to 3.4mm a year, already enough to create adverse effects in coastal areas. A conservative estimate holds that waters will rise roughly 0.9 metres (3ft) by the year 2100, which will place hundreds of millions of people in jeopardy.
Given the scale of sea- and ice-related questions, the vantage point that is needed is from the air and from space, and is best served through large, continuous, state-supported investments: hence Nasa. There is a lot we dont know and a lot that the ice itself, which is a frozen archive of past climate changes, can tell us. But we need the eyes to see it.
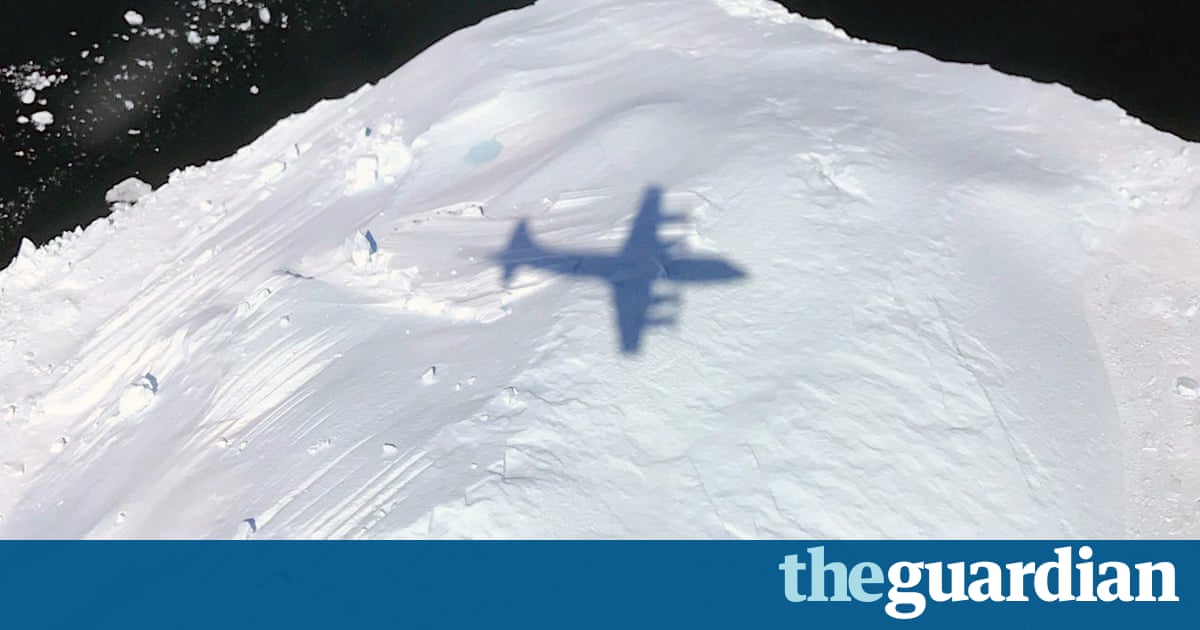
First built during the cold warto track Russian submarines, the P-3 Orion aircraft, a four-engine turboprop, is designed for long, low-flying surveillance missions. IceBridges P-3, based at Wallops Flight Facility in Virginia, is armed with a suite of instruments mounted under the plane and operated by engineers sitting at stations in the cabin. A laser altimetry system which bounces laser beams from the bottom of the aircraft to the top of the ice and back determines the height and topography of the uppermost layer of ice; a digital mapping system takes high-resolution photos of the ice, helping us see the patterns in which it is changing shape; and a radar system sends electromagnetic pulses through the ice, thousands of feet and a hundred thousand years to the land beneath.
This data shows us where the ice is growing and where it is shrinking, and helps researchers determine its current mass. The IceBridge data has also helped create a 3D map of an ice-locked land that no human eyes have ever seen: the territory of Greenland, its mountains, valleys, plains and canyons, and also a clear view of the layers of ice that have grown above it. Nasa repeats its IceBridge flights annually, to chart how the ice changes from year to year, and, by comparison with earlier satellite data, from decade to decade. For the integrity of the data, it is best to repeat the flights over exactly the same terrain. The path of each IceBridge flight must adhere to a line so narrow that they had to invent a new flight navigation system, which Sonntag cannot help but describe with boyish glee (We basically trick the plane into thinking its landing!).
In trying to grasp how the ice works, its necessary to know the shape of the underlying terrain: in places where the land slopes up, for instance, we know that ice will flow slower. IceBridge data helped discover and chart a canyon in northern Greenland the size of the Grand Canyon. In addition to being a wondrous discovery in its own right, this was useful in understanding where, and how, the ice is moving. One effect of this giant canyon system can be seen at the coast, where sea water can seep into cavities, potentially melting lower layers of ice. Other aerial data has shown how glacier fronts, which served as corks holding back the ice flow behind them, have diminished and unleashed the flow, causing more ice to flush into the sea at increasingly rapid paces.
Fantastic 3D maps of the ice sheet created with IceBridge data have also helped researchers locate rare, invaluable Eemian ice, from more than 100,000 years ago. This was an era when the Earth was warm similar to today and in which the seas were many feet higher, which resembles the world to which we are headed. By drilling deep into the ice, glaciologists can excavate ice cores containing specks of materials such as volcanic ash, or frozen bubbles that preserve precious pockets of ancient air that hold chemical samples of long-departed climates. Because of IceBridge data, researchers know where to look for these data-rich ice layers.
These are among the reasons that John Sonntags head hurts, and why he doesnt know where to begin or what to think when people ask him what makes this real for him. Behind even well-meaning questions is a culture of ignorance, or self-interested indifference, that has made it easy for a Republican-led, corporation-owned US government to renege on the Paris climate agreement, to gut the Environmental Protection Agency, and to slash billions of dollars of climate change-related funds from the federal budget this year. When the White House recently proposed cuts to Nasas climate-change research divisions, the media helped them along by burying the story under speciously positive headlines: Trumps Nasa budget supports deep space travel, crowed CBS News. The worlds coasts are facing catastrophic sea rise, but at least Americans can look forward to watching their countrymen grill hot dogs on Mars.
The US built Kangerlussuaqs airfield in the early 1940s, and they still maintain a small airbase there. In 1951, America built a giant fortress on the ice, Thule Air Base, in north-west Greenland strategically equidistant from Russia and the US where it secretly kept armed nuclear weapons. In one of naval historys most ambitious armadas, the Americans cut through the ice, created a port, and effected a conquest second in scope only to the D-day invasion. And all they had to do was uproot an Inuit settlement.
The USs history in Greenland gives the lie to the notion that ice research is inherently peaceful, much less apolitical. Glaciology advanced as a field partly through the work of US scientists serving the needs of their countrys rapidly growing nuclear war machine in the 1960s, helping to build Camp Century, a fabled city under ice in northern Greenland and designing Project Iceworm, a top-secret system of under-ice tunnels nearby, which was intended as a launch site for hidden nuclear missiles. In 1968, at the height of the war in Vietnam, a nuclear-armed B-52 crashed near Thule. A fire, started when a crewman left a pillow over a heating vent, resulted in four atomic weapons hydrogen bombs plunging into the ice, and releasing plutonium into the environment.
When our flight landed in Kangerlussuaq, we passed quickly through passport control, but our bags were nowhere to be found. For 40 minutes we could see the one and only commercial plane at this airfields one and only gate just sitting on the tarmac, with our bags still in it. This wasnt a serious problem Kangerlussuaqs one hotel was just up a short flight of steps from the gate but it did seem odd that the bags hadnt come through customs. Another passenger, sensing my confusion, approached me.
Yankee? he asked.
Yankee, I replied.
Customs, the man told me, was actually just one guy, who had a tendency to mysteriously disappear.
By the way, he added conspiratorially. You know customs here has a special arrangement with the Americans. The customs guy, the stranger told me, turns a blind eye to liquor headed to the US Air Force bar on the other side of the airfield.
Kangerlussuaq (population 500), or as the Yanks prefer to call it, Kanger, still feels like a frontier station. Most locals work either at the airport or at the hotel. Next to the airfields main hangar, local people house the huskies that pull their sledges. The roads of Kangerlussuaq can be dicey; there are no sidewalks. Once you leave the tiny settlement, there arent roads at all; and if you go north or east, of course, theres only ice. Decommissioned US air force Jato bottles jet boosters that, to the untrained eye, resemble small warheads are ubiquitous around Kangerlussuaq, usually as receptacles for discarded cigarette butts. In the hotel cafeteria you can see American and European glaciologists, greeting each other with surprise and hugs, because the last time they met was a year or two ago, when they ran into each other at the other pole.
When I finally got my bag, I made my way down to the 664 barracks, where the crew was staying. But before I met the crew, I met the data itself. In a small, slouchy barracks bedroom, near the front door, I encountered two Nasa servers. IT engineers could, and often would, sit on the bed as they worked.
The window was cracked open, to cool the room and soothe the crackling servers, whose constant low hum, like a shamans chant, was accompanied by the pleasant aroma of gently baking wires one of the more visceral stages of the daily ritual of storing, transferring, copying and processing data captured on the most recent flight. After years of listening to Americans debate the existence of data demonstrating climate change, it was comforting to come in here and smell it.
When I first arrived, I found one of the IT crew, dressed in jeans, T-shirt and slippers, and with big, sad, sleepy, beagle eyes, reclining next to the server, his feet up on a desk, chowing on a Nutella snack pack. He explained the irony of his struggle to keep the servers happy in the far north. A week earlier, when IceBridge was operating its northern flights from Thule Air Base, they couldnt seem to find any way of getting the server rooms temperature down: Were in the Arctic, but our problem is finding cold air.
For a moment he paused to consider the sheer oddness of life, but then he shrugged, and polished off his Nutella snack. But we just chug on, you know? he said.
This attitude captured something essential about IceBridge: its scrappy. Its the kind of operation in which the engineers are expected to bring their own off-the-shelf hardware back-ups from home. (As one radar tech told me: if your keyboard breaks in the Arctic, you cant just go to Walmart and buy a new one.) More than one crew member described IceBridges major piece of hardware, its P-3 aircraft, as a hand-me-down. When the Nasa crew talked about their P-3 they sometimes sounded as though they were talking about a beloved, oversized, elderly pet dog, who can act dopey but, when pressed, is surprisingly agile. IceBridges P-3 is 50 years old, but as one of the navy pilots told me, they baby the hell out of it. It just got a new pair of wings. I got the strong sense that this climate data gathering operation was something of an underdog enterprise the moodier sibling of Nasas more celebrated deep-space projects.
But these unsung flights are not without their own brand of Nasa drama. The IceBridge crew would tell me, with dark humour, the story of the time a plane was in such dire straits that everyone aboard was panicking. One man was staring at a photo of his children on his phone, and in his other hand, was clutching a crucifix. Another man was pinned to the ceiling. Someone actually yelled Were gonna die!, like in the movies. John Sonntag, on the other hand, sat there, serenely assessing the situation.
During my time in Greenland in April this year, I didnt witness Sonntag manage a distressed aircraft, but I did watch him carefully navigate a Nasa crew through a turbulent political season. In the week I was there, the group was preparing for two anxiety-provoking scenarios, courtesy of Washington, DC. One was an imminent visit from several members of Congress. As one engineer put it to me, We just get nervous, honestly, because we dont know what these politicians agenda is: are they friend or foe?
The other was an impending shutdown of the entire US federal government: if Congress didnt make a decision about the budget by Friday that week, the government would close all operations indefinitely. (The sticking point was budgetary questions related to Trumps proposed border wall.) If the government shut down, Operation IceBridge was done for the season; the Nasa crew would be sent home that day.
This had happened before, in 2013, just as IceBridge was en route to Antarctica. Congressional Republicans shut down the government in their effort to thwart Obamas diabolical plot to offer medical care to millions of uninsured Americans. Much of the 2013 mission was cancelled, with millions of dollars, many hundreds of hours of preparation, and, most importantly, critical data, lost.
I still cant really talk about that without feeling those emotions again, Sonntag told me. It was kind of traumatic for us.
The crew of IceBridge was facing an absurd scenario: living in fear of a shutdown of their work by Congress one day and, shortly thereafter, having to smile and impress members of that same Congress.
Conditioned by the tribulationsof modern commercial airline travel, I was unprepared for the casualness of my first Nasa launch. The feeling in the hangar before the flight, and as the crew prepared to launch, was of shift workers who are hyper-attentive to their particular tasks and not the least concerned with gratuitous formalities. The flights were long and the deployments were long; the key to not burning out was to pace oneself and to not linger over anything that wasnt essential. Everyone was a trusted pro and nobody was out to prove anything to anyone else.
Shortly before our 9am takeoff, I asked Sonntag what the plane should feel like when everything was going well what should I be looking for? He smiled sheepishly. To be honest, if you see people sleeping, thats a good sign.
On the eight-hour flights, seeing engineers asleep at their stations meant the instruments below their feet were happily collecting data. For some stretches, there wasnt even data to collect: hours were spent flying between data target sites. (Over the intercom, a pilot would occasionally ask, Hey, we sciencing now or just flying?) Flight crew, who attend to the plane but are not directly connected to the data operation, occupied the cabin like cats, curled up proprietarily, high up on fluffy, folded-up engine covers.
This pervasive somnolence the hypnotic hum of the propellers, the occasional scene of crewmen horsing around in their flight suits, which gave them the look of boys in pajamas coupled with the low-altitude sweeps through fantastic mountains of ice, gave the whole situation a dreamlike quality.
From the windows of the P-3, at 450 metres, you dont need to have read anything about glaciers to know what they are. At that low altitude, you can see the deep textures and the crevasses of the ice, and just how far the glacier extends across the land. The eye immediately grasps that the ice is a creature on the move, positively bursting ahead, while also not appearing to move at all, like a still photo of a rushing river.
Seeing the polar ice from above, you get a very different view from that seen by writers in past centuries, who saw this landscape, if at all, by boat or, more likely, from a drawing. But the vision, to them, was clear enough: it was the End, the annihilating whiteness of death and extinction. Herman Melville described this colour as the dumb blankness, full of meaning, in a wide landscape of snows a colorless all-color of atheism from which we shrink. This is where so many of those old stories terminated. The Arctic is where the monster in Frankenstein leaps off a ship on to the ice, never to be seen again. Polar settings spell doom for Poes sailors, and Captain Nemo, who are pulled into the icy maelstrom. And celebrated real-life travellers did, in fact, die gruesomely on the ice, in search of the Northwest Passage, or the north pole.
But, from the window of Nasas P-3, that old narrative seems inaccurate. Consider that whiteness, which so terrified Melville and Poe, who ends his Antarctic saga The Narrative of Arthur Gordon Pym with a horrifying italicised refrain on the word white. But polar snow and ice, precisely because it is white, with a quality known as high albedo, deflects solar energy back into space and helps keep earths climate cool; the loss of all this white material means more heat is absorbed and the earth warms faster. In a variety of other ways, including moderating weather patterns, the ice helps makes life on earth more livable. The extreme conditions of the poles, so useful for instilling fear in 19th-century readers, actually make the world more habitable.
Our bias against the poles can be detected even in that typical term of praise for this icy landscape, otherworldly. This description is exactly incorrect: the Arctic is intimately connected with every other part of the planet.
This, too, is something you can see. Flying over it, at a low altitude, I was struck by the familiarity of the thing, how much of Greenland was a visual echo of my northern homelands. In the muscular frozen ripples of its glaciers, created by an intensely pressured flow, I saw the same strong hand that deeply etched those giant scratches into the big boulders of Central Park in New York City. This isnt an analogy: those marks in Manhattan were made by shifting ice, the very same ice layers that still have a foothold in Greenland. I grew up, and have spent most of my life, in Ohio and New England, places that were carved out by that ice: ponds originally made of meltwater from the last great ice age, low hills smoothed over by retreating glaciers. That old ice gave shape and signature to almost every important place in my life, and in the lives of so many others. And, in the future, this ice will continue to shape the places were from, right before our eyes. It is only our ignorance that makes us call it otherworldly.
But even as we passed through this landscape, even as the lasers and radars took their deep gulps of data from the ice, I could hear expressions of anxiety from the data hunters. At the same time that were getting better at gathering this data, we seem to be losing the ability to communicate its importance to the public, one engineer told me four hours into a flight, during a transit between glaciers.
You can hear this anxiety surface in the humour floating around the crew. I heard one engineer joke that it might be easier to just rig up a data randomising machine, since many people out there seem to think thats what their data is anyway.
I mean, itd be much easier, and cheaper, to do maintenance on that, he pointed out.
In another conversation, about how to increase public awareness about climate change in the US, I asked one of the senior crew members whether they would welcome a writer from Breitbart aboard one of these flights.
Oh, absolutely, he said. Id love for them to see what were doing here. I think sitting on this plane, seeing the ice, and watching the data come in would be incredibly eye-opening for them.
His optimism was inspiring and worrisome to me.
The mantra of the crew is no politics. I heard it said over and over again: just stick to the job, dont speak above your pay grade. But, of course, you dont need to have a no-politics policy unless your work is already steeped in politics.
Speaking with one of the scientific researchers mid-flight, I got a very revealing reply. When I asked this researcher about the anthropogenesis of climate change, the tone changed. What had been a comfortable chat became stilted and deliberate. There was a little eye-roll toward my audio recorder. Suddenly my interlocutor, a specialist in ice, got pedantic, telling me that there were others more qualified to speak about rising sea levels. I offered to turn off my recorder. As soon as it was off, the researcher spoke freely and with the confidence of a leading expert in the field. The off-the-record view expressed wasnt simply one of sober agreement with the scientific consensus, but of passionate outrage. Of course climate change is related to human activity! Weve all seen the graphs!
The tonal difference between this off-the-record answer and the taped answer that I should consult someone else told me all I needed to know. Or so I thought the researcher then asked me to turn my recorder back on: there was one addendum, for the record.
Richard Nixon, the researcher said, looking down at the red recording light. Nixon established some good climate policy. Theres a tradition in both parties of doing this work. And, I mean, if Nixon
The researcher laughed a bit, realising how this was sounding. Well, thats what Im hanging my hopes on, anyway.
Over the planes open intercom, there was suddenly, and uncharacteristically, talk of the days headlines. While we were in flight, people around the world were marking Earth Day by demonstrating in support of climate rationality and against the current US regime. On Twitter, #MarchForScience was trending at the exact moment Nasas P-3 was out flying for science. There was even a local protest: American and European scientists took to the street of Kangerlussuaq for a small but high-profile demonstration. While it was happening, one of the engineers piped up on the P-3s intercom.
Anyone else sorry to be missing the march?
But the earnest question was only met with silence and a few jokes. Among the Nasa crew, there had been some talk about trying to do a flyover of the Kangerlussuaq march, to take an aerial photo of it, but the plan was nixed for logistical reasons. The timing was off. The senior crew seemed relieved that it was out of the question.
Later that week, after my second and final flight making a total of 16 hours in the air with Nasa the crew retreated to the barracks for a quick science meeting, beers in hand, followed by a family-style dinner. We dont seem to get enough of each other here, one of the engineers told me, as he poured a glass of wine over ice that the crew had harvested from the front of a glacier the day before. One of the engineers asked a glaciologist about the age of this block of ice, and frowned at the disappointing reply: it probably wasnt more than a few hundred years old.
Well, thats still older than America, right? he said.
Outside, the sky wasnt dark, though it was past 10pm. In a couple of months, there would be sunlight all night. After dinner, one of the crews laser technicians lounged on a couch, playing an acoustic version of the song Angie over and over again, creating a pleasantly mesmerising effect. Two crew members talked of killer methane gas. But most sat around, drinking and telling stories. One of the pilots tried to convince someone he had seen a polar bear from the cockpit that day. These deployments are tiring, someone told me. Bullshitting is critical.
One of the crew spent his off-days on excursions with a camera-equipped drone, and had made spectacular videos of his explorations, which he edited and set to moody Bush tunes. I joined the crew as they gathered around his laptop to watch his latest. There was something moving in seeing these people who had spent all day, and indeed many months and years, flying over ice and obsessing over ice-related data now spending their free time relaxing by watching videos of yet more ice.
As usual, politics soon crept into the picture. The next video that popped up was footage recently shot at the Thule base. The video showed some of this same Nasa crew hiking through an abandoned concrete bunker, a former storage site for US Nike anti-aircraft missiles. Today its just an eerie, rusted, shadow-filled underground space, its floor covered in thick ice. When these images came on the screen, the crew fell quiet, watching themselves, only a week ago, putting on ice skates and doing figure-eights over the ruins of their countrys cold war weapons systems.
An engineer chipped a shard off the frozen block harvested the day before. Perhaps sensing my mood, he dropped it into a glass and poured me some whiskey over ice older than America and said: Well anyway, maybe thisll cheer you up.
Early the next morning, before the crew boarded the P-3 for another eight-hour flight over polar ice, a rare political debate broke out. Four of the crew were discussing the imminent Congressional visit, which prompted one of the veteran pilots to recite, once again, the mission mantra: Stick to science: no politics. But because that approach felt increasingly less plausible in 2017, one of the ice specialists, feeling frustrated, launched into a small speech about how Americans dont take data seriously, and how its going to kill us all. Nobody disagreed. Someone jokingly said: Maybe its best if you dont fly today. To which another added, Yeah, you should stay on the ground and just do push-ups all day.
Finally, John Sonntag who had been too busy reviewing flight plans to hear the chatter stood up and tapped his watch. OK guys, he said. Lets go. Its time to fly.
Main image: Nasa/Joe MacGregor
Follow the Long Read on Twitter at @gdnlongread, or sign up to the long read weekly email here.
Read more: www.theguardian.com

")


